Market Overview
So far this week the bears are crushing the bulls in the market. The technicals are confirming this move and we have reached a breaking point in the market.
With the past two days of decline on the DOW, we have moved from 10763 to 10389 which is a 374 point decline and has put us directly at a major support level. The last time this happened was in November of 2009 in which we moved from 10157 to 9650 which was a 507 point decline. During this decline the market was able to maintain the first support and continued to make gains.
This most recent time however we have accelerated down through the first support level and are now just above the next. To understand this further, in November 2009 we had a 5% decline in the DOW which was able to maintain the support level and then gained 11%. This time we have fallen through the first support level with only a 3.5% decline from the high.
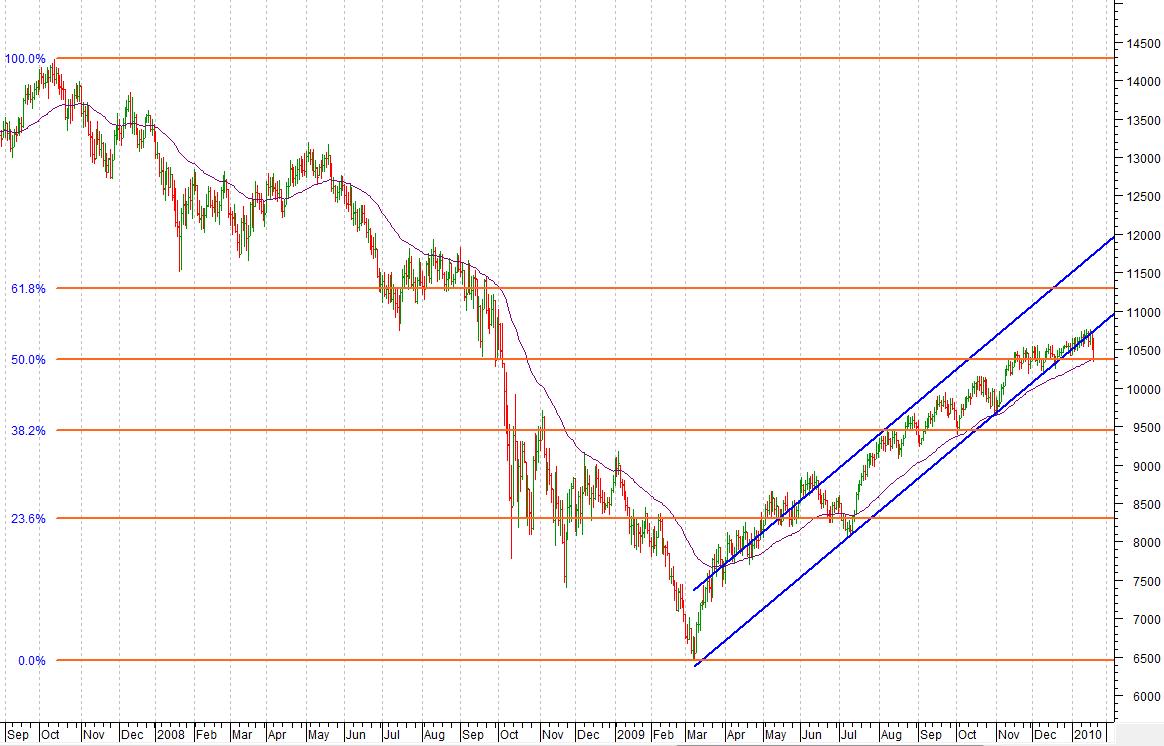
Using the Fibonacci method we have now completed a 50% retracement of the decline from 14000 to 6500. This is very similar to the November decline in that we had recently completed the 38.2% retracement and nearly reached a 50% retracement. Again, the technicals are very similar to the November decline with the only difference being that we have broken through the first support level.
This week the DOW has accelerated through the support level with a 3.5% decline. The most concerning thing with the technicals now is simply the support levels. Our models are showing mixed signals currently in that half are giving a gain signal, and the other half are giving a decline signal. Simply put, if the DOW falls through 10370 and maintains a price below this support, it should signal a decline to the next strong support at 9700.
And for those of you interested in how these support levels are reached, I have included a graph which shows the channel that we have been trading in since March of 2009 as well as the Fibonacci retracement levels. The channel is represented by the blue parallel lines and the Fibonacci is represented by the orange dashed lines. The Red/Green Bars represent the DOW. Click to open a larger version in a new browser window.
© 2026 Benzinga.com. Benzinga does not provide investment advice. All rights reserved.
Posted-In: DOW Dow JonesPrice Target Technicals Pre-Market Outlook Intraday Update Trading Ideas