Nasdaq 100's Historical Move: Tech Stocks Log Fastest Snapback Rally In 40-Year History

Something never seen before just happened to the Nasdaq 100 as tech stocks sharply rallied following the ceasefire announcement and optimism around a potential deal to reopen the Strait of Hormuz.
The index’s 14-day Relative Strength Index — a widely followed momentum gauge that measures the speed and size of price moves on a scale from 0 to 100 — hit a low of 28 on March 30, 2026, deep in oversold territory.
By April 15, it had climbed to 70.5, crossing into overbought territory. The time elapsed: 11 trading sessions.
That is the fastest oversold-to-overbought RSI transition in the Nasdaq 100’s 40-year recorded history, according to the TradingView RSI Transition Speed indicator.
It has never happened this quickly — not during the pandemic recovery, not after the dot-com bust, not during any prior relief rally in the index’s history.
Nasdaq 100 Went From Oversold To Overbought In Just 11 Sessions
Over 40 years of data, the Nasdaq 100 – as tracked by the Invesco QQQ Trust (NASDAQ:QQQ) – has made this same oversold-to-overbought journey 35 times.
The RSI itself is a measure of momentum, not direction — it gauges how aggressively prices are moving relative to their recent history, not where they are going next. An overbought reading does not signal an imminent reversal. It signals that buying pressure has been exceptionally concentrated.
On average it has taken 67 sessions — roughly three months of trading.
The fastest prior transition before this week was 20 sessions, recorded in November 2021. The longest was 232 sessions, in June 2003, when the index spent nearly a year grinding back from the depths of the dot-com crash.
For context: last April, when President Donald Trump reversed his Liberation Day tariff package and sparked a similar tech-led relief rally, the Nasdaq 100 took 25 sessions to complete the same oversold-to-overbought transition. That was considered fast at the time — less than half the historical average.
The current rally did it in less than half of that.
What the 11-session figure does capture precisely is the intensity of the repricing the market has assigned to the ceasefire scenario in Iran.
In less time than it takes most earnings seasons to complete, tech investors moved from maximum fear to maximum optimism — the fastest such swing ever recorded in this index.
Whether the underlying reality has moved as fast as the RSI is the question the next sessions will begin to answer.
Episode
Context
Sessions
Apr 2026All-time record
Hormuz rebound
11
Nov 2021
Prior fastest — before this week
20
Apr 2025
Liberation Day tariff reversal
25
39-year average
All 35 prior transitions since 1987
67
Jun 2003
Historical maximum — dot-com recovery
232
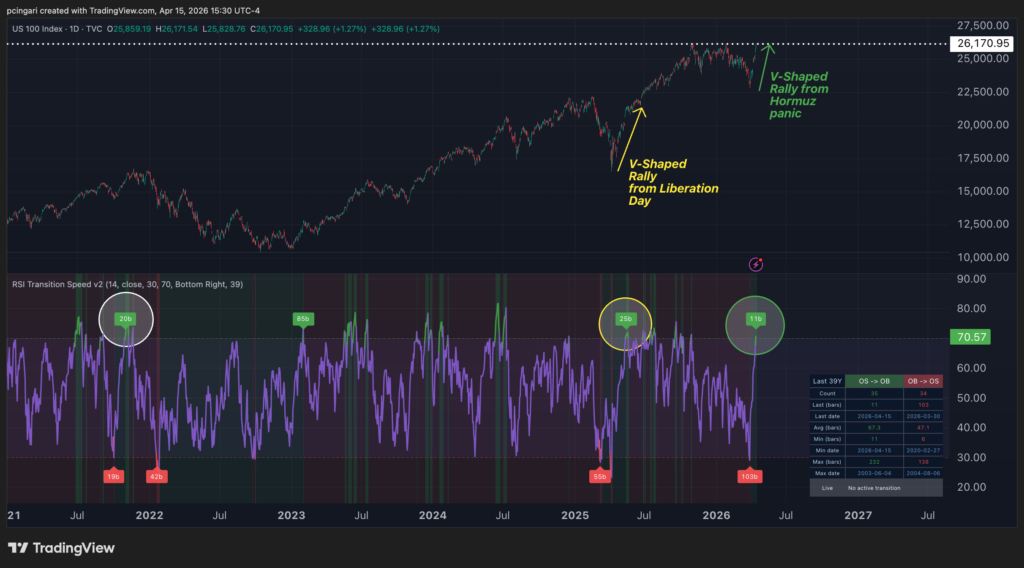
Photo: Shutterstock
© 2026 Benzinga.com. Benzinga does not provide investment advice. All rights reserved.
Posted-In: Equities Broad U.S. Equity ETFs Top Stories Tech ETFs